|
操作系统进程检查
Pmon检查
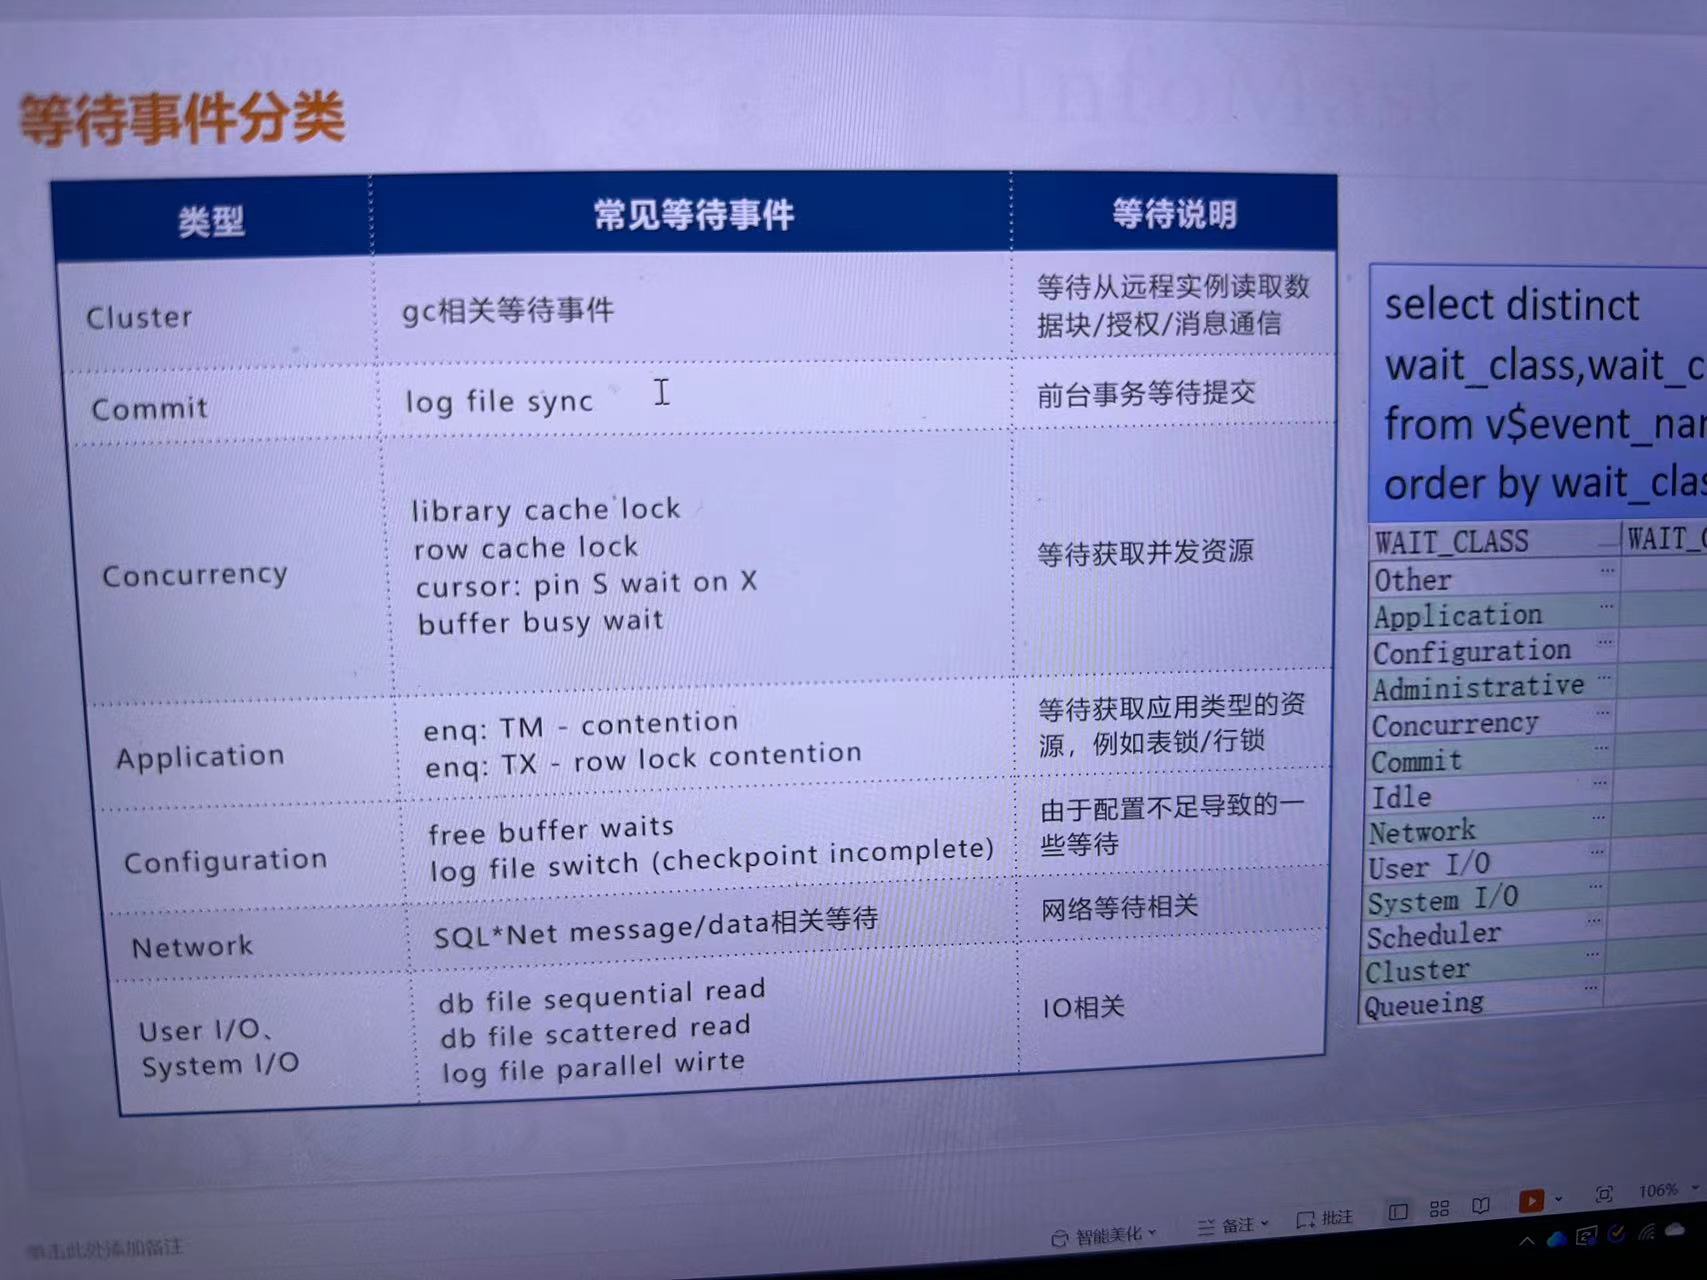
pmon(Process Monitor process)用于监控其他后台进程。负责在连接出现异常中止后进行清理工作。例如,一个专用服务器进程崩溃或者出于某种原因被结束掉,就要由PMON进程负责善后(恢复或者撤销工作),并释放资源。PMON会回滚未提交的工作,释放锁,并释放之前为失败进程分配的SGA资源。 因此在操作系统侧,可以首先检查pmon进程 092755.221: [oracle ~ ]$ ps -ef |grep -i pmon 092755.266: oracle 22589 22483 0 09:27 pts/1 00:00:00 grep --color=auto -i pmon 092755.271: grid 41673 1 0 Nov03 ? 00:00:19 asm_pmon_+ASM1 092755.271: oracle 43062 1 0 Nov03 ? 00:00:55 ora_pmon_oracle1 负载检查 [oracle@ ~ ]$ top 094246.285: top - 09:42:46 up 3 days, 13:45, 2 users, load average: 0.44, 0.49, 0.60 094246.290: Tasks: 1179 total, 2 running, 1177 sleeping, 0 stopped, 0 zombie 094246.290: %Cpu(s): 2.7 us, 0.6 sy, 0.0 ni, 96.7 id, 0.0 wa, 0.0 hi, 0.0 si, 0.0 st 094246.290: KiB Mem: 26347395+total, 24792364+used, 15550296 free, 1356312 buffers 094246.290: KiB Swap: 33554428 total, 8960 used, 33545468 free. 71150048 cached Mem 094246.295: 094246.295: PID USER PR NI VIRT RES SHR S %CPU %MEM TIME+ COMMAND 094246.295: 35858 oracle 20 0 0.148t 88408 83244 R 100.00 0.034 0:21.06 oracle_35858_or 094246.295: 36340 oracle 20 0 0.148t 85412 80980 S 11.111 0.032 0:00.04 oracle_36340_or 094246.295: 36341 oracle 20 0 16348 3500 2224 R 11.111 0.001 0:00.05 top 094246.295: 35766 root 20 0 5509468 156808 31652 S 5.556 0.060 23:24.58 java 094246.295: 36338 oracle 20 0 0.148t 85392 80960 S 5.556 0.032 0:00.04 oracle_36338_or 094246.295: 1 root 20 0 181660 6184 4180 S 0.000 0.002 2:08.17 systemd 094246.295: 2 root 20 0 0 0 0 S 0.000 0.000 0:00.12 kthreadd 094246.295: 4 root 0 -20 0 0 0 S 0.000 0.000 0:00.00 kworker/0:0H 094246.295: 6 root 0 -20 0 0 0 S 0.000 0.000 0:00.00 mm_percpu_wq 094246.295: 7 root 20 0 0 0 0 S 0.000 0.000 0:13.67 ksoftirqd/0 094246.295: 8 root 20 0 0 0 0 S 0.000 0.000 6:47.36 rcu_sched 094246.295: 9 root 20 0 0 0 0 S 0.000 0.000 0:00.00 rcu_bh 094246.295: 10 root rt 0 0 0 0 S 0.000 0.000 0:00.00 migration/0 094246.295: 11 root rt 0 0 0 0 S 0.000 0.000 0:00.37 watchdog/0 094246.295: 12 root 20 0 0 0 0 S 0.000 0.000 0:00.00 cpuhp/0 094246.295: 13 root 20 0 0 0 0 S 0.000 0.000 0:00.00 cpuhp/1 094246.295: 14 root rt 0 0 0 0 S 0.000 0.000 0:00.36 watchdog/1 094246.295: 15 root rt 0 0 0 0 S 0.000 0.000 0:00.01 migration/1 094246.295: 16 root 20 0 0 0 0 S 0.000 0.000 0:03.20 ksoftirqd/1 094246.295: 18 root 0 -20 0 0 0 S 0.000 0.000 0:00.00 kworker/1:0H 094246.295: 19 root 20 0 0 0 0 S 0.000 0.000 0:00.00 cpuhp/2 094246.295: 20 root rt 0 0 0 0 S 0.000 0.000 0:00.37 watchdog/2 094246.295: 21 root rt 0 0 0 0 S 0.000 0.000 0:00.01 migration/2 094246.300: 22 root 20 0 0 0 0 S 0.000 0.000 0:02.63 ksoftirqd/2 094246.300: 24 root 0 -20 0 0 0 S 0.000 0.000 0:00.00 kworker/2:0H 094246.300: 25 root 20 0 0 0 0 S 0.000 0.000 0:00.00 cpuhp/3 094246.300: 26 root rt 0 0 0 0 S 0.000 0.000 0:00.38 watchdog/3 094246.300: 27 root rt 0 0 0 0 S 0.000 0.000 0:00.01 migration/3 094246.300: 28 root 20 0 0 0 0 S 0.000 0.000 0:01.19 ksoftirqd/3 094246.300: 30 root 0 -20 0 0 0 S 0.000 0.000 0:00.00 kworker/3:0H 094246.320: 31 root 20 0 0 0 0 S 0.000 0.000 0:00.00 cpuhp/4 094246.320: 32 root rt 0 0 0 0 S 0.000 0.000 0:00.39 watchdog/4 094246.320: 33 root rt 0 0 0 0 S 0.000 0.000 0:00.00 migration/4 094246.320: 34 root 20 0 0 0 0 S 0.000 0.000 0:02.01 ksoftirqd/4 094246.320: 36 root 0 -20 0 0 0 S 0.000 0.000 0:00.00 kworker/4:0H 094246.320: 37 root 20 0 0 0 0 S 0.000 0.000 0:00.00 cpuhp/5 094246.320: 38 root rt 0 0 0 0 S 0.000 0.000 0:00.40 watchdog/5 094246.320: 39 root rt 0 0 0 0 S 0.000 0.000 0:00.00 migration/5 094246.320: 40 root 20 0 0 0 0 S 0.000 0.000 0:03.99 ksoftirqd/5 094246.320: 42 root 0 -20 0 0 0 S 0.000 0.000 0:00.00 kworker/5:0H 094246.320: 43 root 20 0 0 0 0 S 0.000 0.000 0:00.00 cpuhp/6 094246.325: 44 root rt 0 0 0 0 S 0.000 0.000 0:00.39 watchdog/6 094246.325: 45 root rt 0 0 0 0 S 0.000 0.000 0:00.00 migration/6 094246.325: 46 root 20 0 0 0 0 S 0.000 0.000 0:02.34 ksoftirqd/6 094246.325: 48 root 0 -20 0 0 0 S 0.000 0.000 0:00.00 kworker/6:0H 094246.325: 49 root 20 0 0 0 0 S 0.000 0.000 0:00.00 cpuhp/7 094246.325: 50 root rt 0 0 0 0 S 0.000 0.000 0:00.40 watchdog/7 094246.325: 51 root rt 0 0 0 0 S 0.000 0.000 0:00.00 migration/7 094246.325: 52 root 20 0 0 0 0 S 0.000 0.000 0:01.66 ksoftirqd/7 094246.325: 54 root 0 -20 0 0 0 S 0.000 0.000 0:00.00 kworker/7:0H 094246.325: 55 root 20 0 0 0 0 S 0.000 0.000 0:00.00 cpuhp/8 094246.325: 56 root rt 0 0 0 0 S 0.000 0.000 0:00.37 watchdog/8 数据库检查 查看数据库打开状态和相关信息确定当前库为主库 093045.590: SQL> select inst_id,open_mode,database_role from gv$database; 093045.610: 093045.610: INST_ID OPEN_MODE DATABASE_ROLE 093045.610: ---------- -------------------- ---------------- 093045.610: 2 READ WRITE PRIMARY 093045.610: 1 READ WRITE PRIMARY 查找主库 show parameter config show parameter unique (主库唯一名) show parameter log_archive_config(主库 备库唯一名都能看到,由此确认备库唯一名) 判断集群正常与否 判断会话等待检查以下会话等待,主要最多的会话等待没有以下几项即可
|